About UK 100 Index
The UK Financial Times Stock Exchange 100 is an index of share prices of the largest 100 companies listed on the London Stock Exchange (LSE) by market capitalisation. The index was launched on January 3, 1984 at a base value of 1000, and the index level is calculated in real-time.
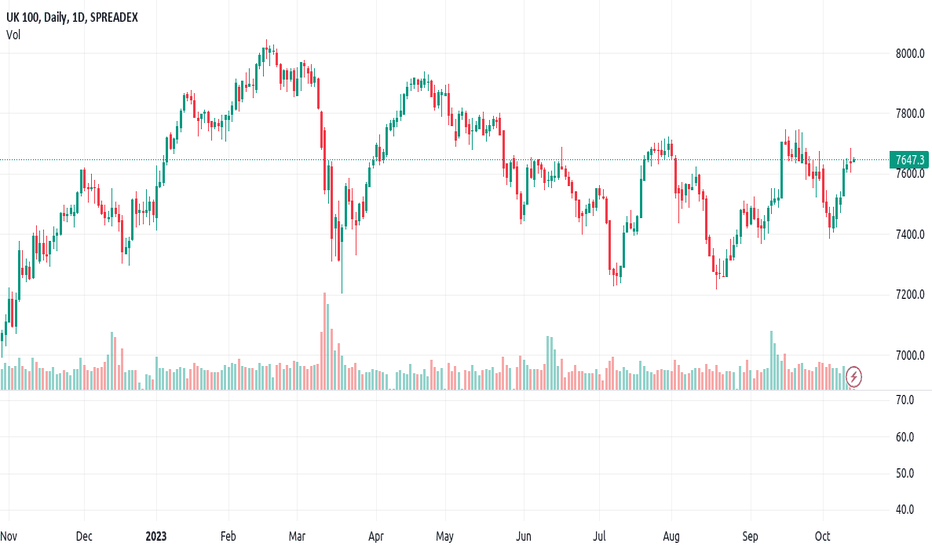
#UK100UK100 start its correction from 20 feb 2023 and complete a flat correction on 4 july 2023.
After that it form a X wave on 26 july 2023 .
From 26 july it enter into a triangle correction and complete its E wave on 13 feb 2024.
Also the price gives a pattern conformation.
So we can expect a 7-8 % upsi
UK100 (FTSE) - LIKELY TO DO A THIRD UPWARDS?UK100 has a clear 5 wave up from COVID-19 lows.
This is either an ABC pattern or a five-wave impulse. In either case, we should anticipate a significant move. Such big moves sometimes come after sentimental extremes or events - which is much awaited.
If this transpires, would be led by a commodi
FTSE100 indexIs the UK index or the FTSE100 index ready for a big rally in the coming days ??charts show a highly bullish breakout and also sustaining above the resistance of 7600 levels , index has almost 20% upside open before any major hurdles , 6 days to go for monthly candle closing and a closing above 7600
See all ideas
Summarizing what the indicators are suggesting.
Oscillators
Neutral
SellBuy
Strong sellStrong buy
Strong sellSellNeutralBuyStrong buy
Oscillators
Neutral
SellBuy
Strong sellStrong buy
Strong sellSellNeutralBuyStrong buy
Summary
Neutral
SellBuy
Strong sellStrong buy
Strong sellSellNeutralBuyStrong buy
Summary
Neutral
SellBuy
Strong sellStrong buy
Strong sellSellNeutralBuyStrong buy
Summary
Neutral
SellBuy
Strong sellStrong buy
Strong sellSellNeutralBuyStrong buy
Moving Averages
Neutral
SellBuy
Strong sellStrong buy
Strong sellSellNeutralBuyStrong buy
Moving Averages
Neutral
SellBuy
Strong sellStrong buy
Strong sellSellNeutralBuyStrong buy
Displays a symbol's price movements over previous years to identify recurring trends.
Related indices
Frequently Asked Questions
The current value of UK 100 Index is 8,554.81 GBP — it has risen by 0.27% in the past 24 hours. Track the index more closely on the UK 100 Index chart.
UK 100 Index reached its highest quote on Mar 3, 2025 — 8,908.82 GBP. See more data on the UK 100 Index chart.
The lowest ever quote of UK 100 Index is 1,717.70 GBP. It was reached on Sep 9, 1988. See more data on the UK 100 Index chart.
UK 100 Index value has increased by 0.68% in the past week, since last month it has shown a 8.14% increase, and over the year it's increased by 2.40%. Keep track of all changes on the UK 100 Index chart.
The champion of UK 100 Index is LSE:CCEP — it's gained 9.86 K% over the year.
The weakest component of UK 100 Index is LSE:CRDA — it's lost −35.86% over the year.
UK 100 Index is just a number that lets you track performance of the instruments comprising the index, so you can't invest in it directly. But you can buy UK 100 Index futures or funds or invest in its components.
The UK 100 Index is comprised of 100 instruments including LSE:AZN, LSE:HSBA, LSE:SHEL and others. See the full list of UK 100 Index components to find more opportunities.


